|
Download Data (XLS File) |
|
|||||
|
|||||
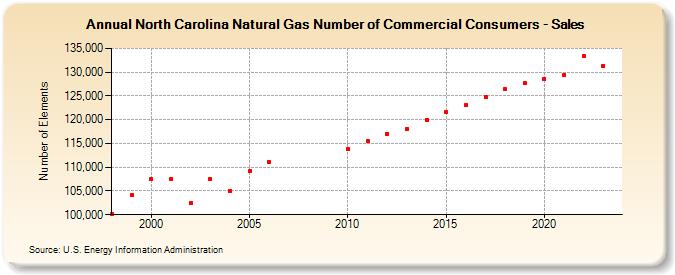
| North Carolina Natural Gas Number of Commercial Consumers - Sales (Number of Elements) | |||||
| Decade | Year-0 | Year-1 | Year-2 | Year-3 | Year-4 | Year-5 | Year-6 | Year-7 | Year-8 | Year-9 |
|---|---|---|---|---|---|---|---|---|---|---|
| 1990's | 100,106 | 104,151 | ||||||||
| 2000's | 107,424 | 107,592 | 102,443 | 107,445 | 105,087 | 109,134 | 111,046 | |||
| 2010's | 113,788 | 115,496 | 117,039 | 118,135 | 119,984 | 121,711 | 123,059 | 124,778 | 126,427 | 127,741 |
| 2020's | 128,540 | 129,420 | 133,346 | 131,308 | 134,824 |
| - = No Data Reported; -- = Not Applicable; NA = Not Available; W = Withheld to avoid disclosure of individual company data. |
| Release Date: 6/30/2026 |
| Next Release Date: 7/31/2026 |