|
Download Data (XLS File) |
|
|||||
|
|||||
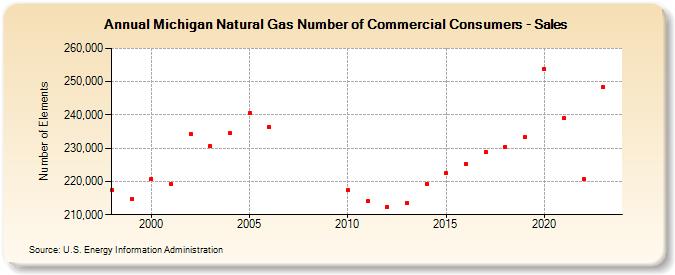
| Michigan Natural Gas Number of Commercial Consumers - Sales (Number of Elements) | |||||
| Decade | Year-0 | Year-1 | Year-2 | Year-3 | Year-4 | Year-5 | Year-6 | Year-7 | Year-8 | Year-9 |
|---|---|---|---|---|---|---|---|---|---|---|
| 1990's | 217,315 | 214,846 | ||||||||
| 2000's | 220,814 | 219,204 | 234,332 | 230,557 | 234,484 | 240,566 | 236,447 | |||
| 2010's | 217,325 | 213,995 | 212,411 | 213,532 | 219,240 | 222,427 | 225,286 | 228,739 | 230,472 | 233,359 |
| 2020's | 253,871 | 238,926 | 220,705 | 248,243 | 249,859 |
| - = No Data Reported; -- = Not Applicable; NA = Not Available; W = Withheld to avoid disclosure of individual company data. |
| Release Date: 6/30/2026 |
| Next Release Date: 7/31/2026 |