|
Download Data (XLS File) |
|
|||||
|
|||||
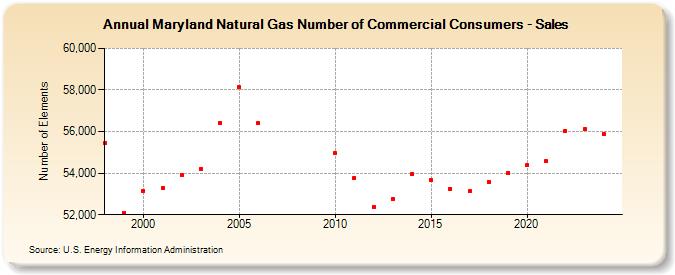
| Maryland Natural Gas Number of Commercial Consumers - Sales (Number of Elements) | |||||
| Decade | Year-0 | Year-1 | Year-2 | Year-3 | Year-4 | Year-5 | Year-6 | Year-7 | Year-8 | Year-9 |
|---|---|---|---|---|---|---|---|---|---|---|
| 1990's | 55,443 | 52,101 | ||||||||
| 2000's | 53,155 | 53,287 | 53,932 | 54,214 | 56,424 | 58,141 | 56,405 | |||
| 2010's | 54,966 | 53,778 | 52,383 | 52,763 | 53,961 | 53,651 | 53,251 | 53,122 | 53,588 | 54,010 |
| 2020's | 54,374 | 54,568 | 56,047 | 56,117 | 55,892 |
| - = No Data Reported; -- = Not Applicable; NA = Not Available; W = Withheld to avoid disclosure of individual company data. |
| Release Date: 6/30/2026 |
| Next Release Date: 7/31/2026 |