|
Download Data (XLS File) |
|
|||||
|
|||||
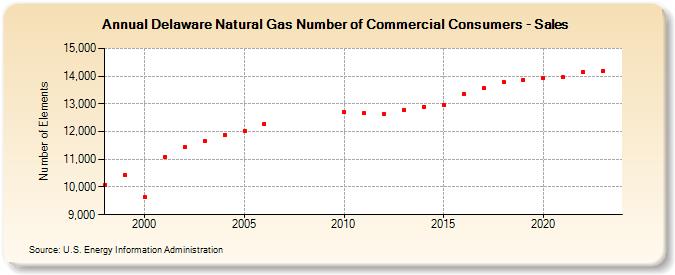
| Delaware Natural Gas Number of Commercial Consumers - Sales (Number of Elements) | |||||
| Decade | Year-0 | Year-1 | Year-2 | Year-3 | Year-4 | Year-5 | Year-6 | Year-7 | Year-8 | Year-9 |
|---|---|---|---|---|---|---|---|---|---|---|
| 1990's | 10,081 | 10,440 | ||||||||
| 2000's | 9,638 | 11,074 | 11,437 | 11,654 | 11,884 | 12,034 | 12,288 | |||
| 2010's | 12,706 | 12,656 | 12,644 | 12,777 | 12,902 | 12,967 | 13,366 | 13,555 | 13,795 | 13,867 |
| 2020's | 13,936 | 13,951 | 14,157 | 14,181 | 14,332 |
| - = No Data Reported; -- = Not Applicable; NA = Not Available; W = Withheld to avoid disclosure of individual company data. |
| Release Date: 6/30/2026 |
| Next Release Date: 7/31/2026 |