|
Download Data (XLS File) |
|
|||||
|
|||||
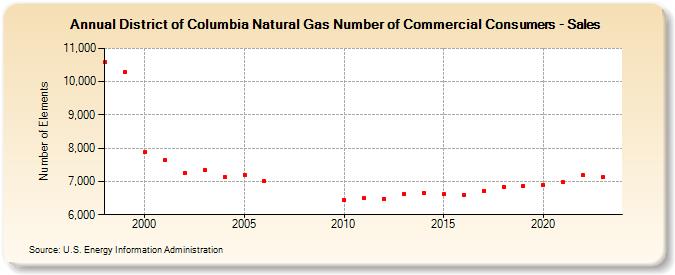
| District of Columbia Natural Gas Number of Commercial Consumers - Sales (Number of Elements) | |||||
| Decade | Year-0 | Year-1 | Year-2 | Year-3 | Year-4 | Year-5 | Year-6 | Year-7 | Year-8 | Year-9 |
|---|---|---|---|---|---|---|---|---|---|---|
| 1990's | 10,580 | 10,283 | ||||||||
| 2000's | 7,872 | 7,635 | 7,247 | 7,350 | 7,138 | 7,204 | 7,004 | |||
| 2010's | 6,429 | 6,494 | 6,478 | 6,636 | 6,665 | 6,612 | 6,607 | 6,723 | 6,836 | 6,876 |
| 2020's | 6,891 | 6,974 | 7,181 | 7,120 | 7,115 |
| - = No Data Reported; -- = Not Applicable; NA = Not Available; W = Withheld to avoid disclosure of individual company data. |
| Release Date: 6/30/2026 |
| Next Release Date: 7/31/2026 |