|
Download Data (XLS File) |
|
|||||
|
|||||
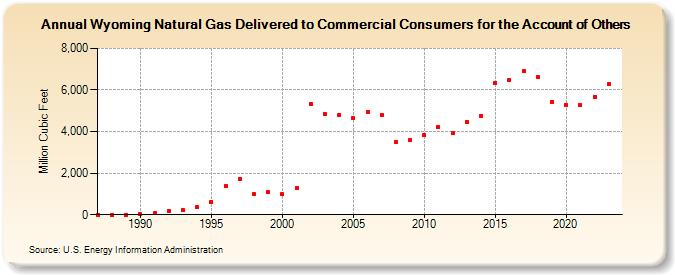
| Wyoming Natural Gas Delivered to Commercial Consumers for the Account of Others (Million Cubic Feet) | |||||
| Decade | Year-0 | Year-1 | Year-2 | Year-3 | Year-4 | Year-5 | Year-6 | Year-7 | Year-8 | Year-9 |
|---|---|---|---|---|---|---|---|---|---|---|
| 1980's | 0 | 0 | 7 | |||||||
| 1990's | 21 | 89 | 160 | 207 | 358 | 632 | 1,370 | 1,705 | 987 | 1,070 |
| 2000's | 974 | 1,291 | 5,338 | 4,824 | 4,816 | 4,657 | 4,963 | 4,788 | 3,501 | 3,581 |
| 2010's | 3,857 | 4,210 | 3,920 | 4,456 | 4,772 | 6,354 | 6,475 | 6,890 | 6,618 | 5,440 |
| 2020's | 5,289 | 5,289 | 5,677 | 6,279 | 5,699 |
| - = No Data Reported; -- = Not Applicable; NA = Not Available; W = Withheld to avoid disclosure of individual company data. |
| Release Date: 6/30/2026 |
| Next Release Date: 7/31/2026 |