|
Download Data (XLS File) |
|
|||||
|
|||||
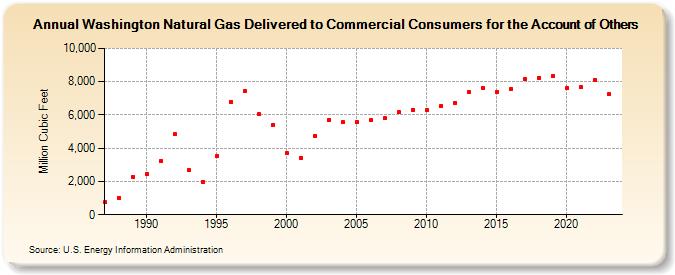
| Washington Natural Gas Delivered to Commercial Consumers for the Account of Others (Million Cubic Feet) | |||||
| Decade | Year-0 | Year-1 | Year-2 | Year-3 | Year-4 | Year-5 | Year-6 | Year-7 | Year-8 | Year-9 |
|---|---|---|---|---|---|---|---|---|---|---|
| 1980's | 740 | 1,022 | 2,291 | |||||||
| 1990's | 2,462 | 3,247 | 4,831 | 2,671 | 1,993 | 3,514 | 6,795 | 7,440 | 6,026 | 5,405 |
| 2000's | 3,691 | 3,439 | 4,739 | 5,722 | 5,557 | 5,589 | 5,671 | 5,797 | 6,158 | 6,320 |
| 2010's | 6,273 | 6,535 | 6,732 | 7,352 | 7,634 | 7,370 | 7,560 | 8,143 | 8,246 | 8,338 |
| 2020's | 7,606 | 7,653 | 8,110 | 7,253 | 7,276 |
| - = No Data Reported; -- = Not Applicable; NA = Not Available; W = Withheld to avoid disclosure of individual company data. |
| Release Date: 6/30/2026 |
| Next Release Date: 7/31/2026 |