|
Download Data (XLS File) |
|
|||||
|
|||||
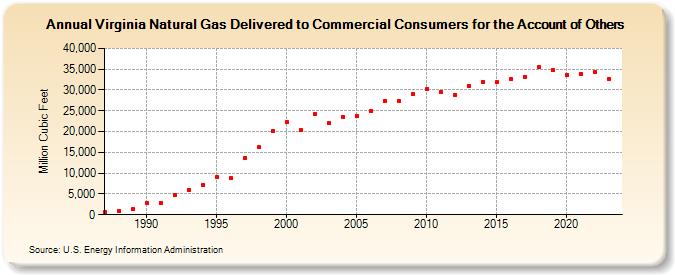
| Virginia Natural Gas Delivered to Commercial Consumers for the Account of Others (Million Cubic Feet) | |||||
| Decade | Year-0 | Year-1 | Year-2 | Year-3 | Year-4 | Year-5 | Year-6 | Year-7 | Year-8 | Year-9 |
|---|---|---|---|---|---|---|---|---|---|---|
| 1980's | 590 | 997 | 1,274 | |||||||
| 1990's | 2,804 | 2,826 | 4,719 | 5,902 | 7,039 | 9,062 | 8,712 | 13,705 | 16,267 | 20,043 |
| 2000's | 22,239 | 20,479 | 24,189 | 21,972 | 23,508 | 23,790 | 25,017 | 27,351 | 27,379 | 29,016 |
| 2010's | 30,179 | 29,504 | 28,857 | 30,949 | 31,875 | 31,821 | 32,627 | 33,181 | 35,411 | 34,770 |
| 2020's | 33,645 | 33,871 | 34,404 | 32,734 | 33,346 |
| - = No Data Reported; -- = Not Applicable; NA = Not Available; W = Withheld to avoid disclosure of individual company data. |
| Release Date: 5/29/2026 |
| Next Release Date: 6/30/2026 |