|
Download Data (XLS File) |
|
|||||
|
|||||
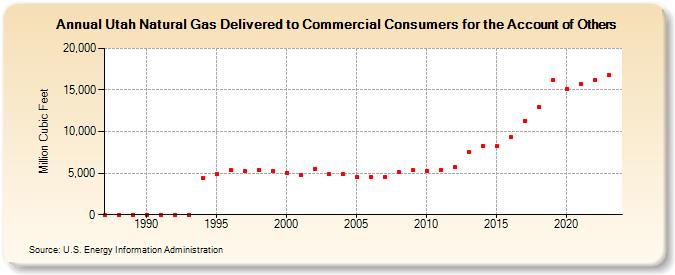
| Utah Natural Gas Delivered to Commercial Consumers for the Account of Others (Million Cubic Feet) | |||||
| Decade | Year-0 | Year-1 | Year-2 | Year-3 | Year-4 | Year-5 | Year-6 | Year-7 | Year-8 | Year-9 |
|---|---|---|---|---|---|---|---|---|---|---|
| 1980's | 0 | 0 | 0 | |||||||
| 1990's | 0 | 0 | 0 | 0 | 4,438 | 4,892 | 5,360 | 5,222 | 5,427 | 5,204 |
| 2000's | 5,052 | 4,813 | 5,469 | 4,837 | 4,850 | 4,533 | 4,510 | 4,516 | 5,103 | 5,338 |
| 2010's | 5,307 | 5,392 | 5,681 | 7,539 | 8,283 | 8,217 | 9,348 | 11,318 | 12,975 | 16,176 |
| 2020's | 15,061 | 15,717 | 16,259 | 16,760 | 15,845 |
| - = No Data Reported; -- = Not Applicable; NA = Not Available; W = Withheld to avoid disclosure of individual company data. |
| Release Date: 5/29/2026 |
| Next Release Date: 6/30/2026 |