|
Download Data (XLS File) |
|
|||||
|
|||||
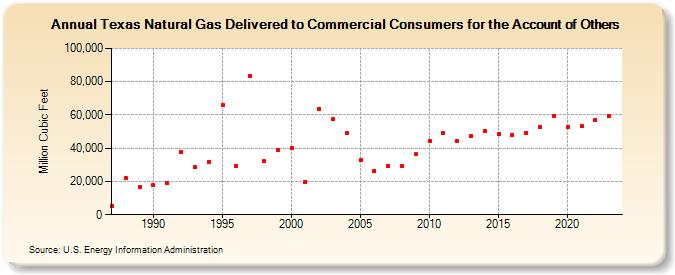
| Texas Natural Gas Delivered to Commercial Consumers for the Account of Others (Million Cubic Feet) | |||||
| Decade | Year-0 | Year-1 | Year-2 | Year-3 | Year-4 | Year-5 | Year-6 | Year-7 | Year-8 | Year-9 |
|---|---|---|---|---|---|---|---|---|---|---|
| 1980's | 5,402 | 21,863 | 16,935 | |||||||
| 1990's | 17,645 | 19,287 | 37,443 | 28,423 | 31,742 | 65,911 | 29,469 | 83,494 | 32,280 | 39,041 |
| 2000's | 39,939 | 19,885 | 63,710 | 57,523 | 49,000 | 32,812 | 26,523 | 29,257 | 29,233 | 36,338 |
| 2010's | 44,212 | 49,056 | 44,453 | 47,228 | 50,618 | 48,808 | 48,095 | 49,009 | 53,014 | 59,554 |
| 2020's | 52,969 | 53,434 | 57,203 | 59,439 | 57,903 |
| - = No Data Reported; -- = Not Applicable; NA = Not Available; W = Withheld to avoid disclosure of individual company data. |
| Release Date: 5/29/2026 |
| Next Release Date: 6/30/2026 |