|
Download Data (XLS File) |
|
|||||
|
|||||
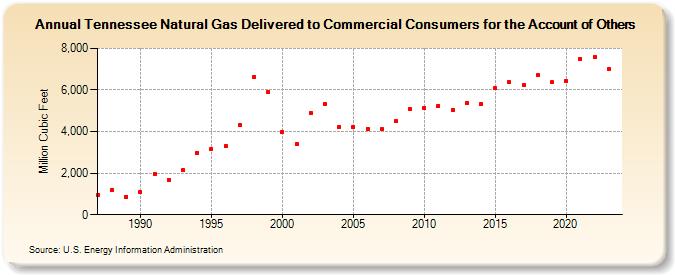
| Tennessee Natural Gas Delivered to Commercial Consumers for the Account of Others (Million Cubic Feet) | |||||
| Decade | Year-0 | Year-1 | Year-2 | Year-3 | Year-4 | Year-5 | Year-6 | Year-7 | Year-8 | Year-9 |
|---|---|---|---|---|---|---|---|---|---|---|
| 1980's | 949 | 1,191 | 864 | |||||||
| 1990's | 1,092 | 1,961 | 1,680 | 2,129 | 2,992 | 3,163 | 3,316 | 4,312 | 6,635 | 5,885 |
| 2000's | 3,987 | 3,403 | 4,893 | 5,347 | 4,232 | 4,237 | 4,139 | 4,115 | 4,496 | 5,076 |
| 2010's | 5,144 | 5,247 | 5,029 | 5,365 | 5,332 | 6,091 | 6,363 | 6,249 | 6,709 | 6,364 |
| 2020's | 6,454 | 7,511 | 7,583 | 6,992 | 7,223 |
| - = No Data Reported; -- = Not Applicable; NA = Not Available; W = Withheld to avoid disclosure of individual company data. |
| Release Date: 5/29/2026 |
| Next Release Date: 6/30/2026 |