|
Download Data (XLS File) |
|
|||||
|
|||||
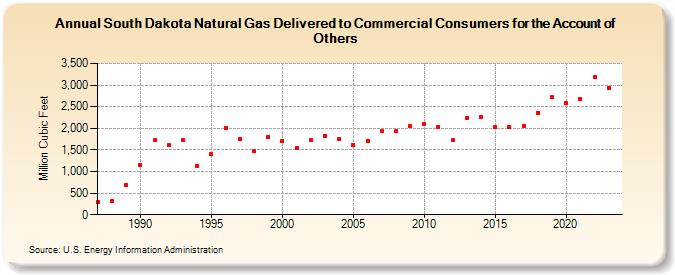
| South Dakota Natural Gas Delivered to Commercial Consumers for the Account of Others (Million Cubic Feet) | |||||
| Decade | Year-0 | Year-1 | Year-2 | Year-3 | Year-4 | Year-5 | Year-6 | Year-7 | Year-8 | Year-9 |
|---|---|---|---|---|---|---|---|---|---|---|
| 1980's | 298 | 321 | 695 | |||||||
| 1990's | 1,161 | 1,723 | 1,603 | 1,724 | 1,124 | 1,406 | 2,008 | 1,742 | 1,466 | 1,802 |
| 2000's | 1,711 | 1,535 | 1,739 | 1,832 | 1,758 | 1,617 | 1,703 | 1,943 | 1,931 | 2,059 |
| 2010's | 2,100 | 2,030 | 1,721 | 2,235 | 2,268 | 2,029 | 2,032 | 2,063 | 2,360 | 2,725 |
| 2020's | 2,591 | 2,688 | 3,179 | 2,939 | 2,758 |
| - = No Data Reported; -- = Not Applicable; NA = Not Available; W = Withheld to avoid disclosure of individual company data. |
| Release Date: 6/30/2026 |
| Next Release Date: 7/31/2026 |