|
Download Data (XLS File) |
|
|||||
|
|||||
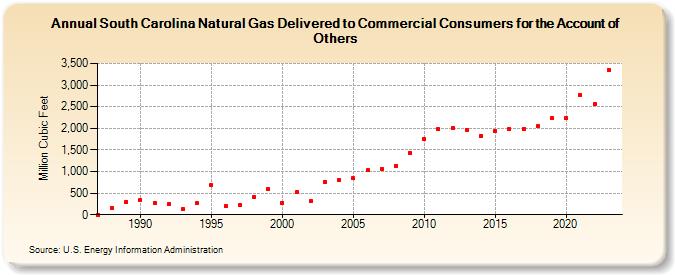
| South Carolina Natural Gas Delivered to Commercial Consumers for the Account of Others (Million Cubic Feet) | |||||
| Decade | Year-0 | Year-1 | Year-2 | Year-3 | Year-4 | Year-5 | Year-6 | Year-7 | Year-8 | Year-9 |
|---|---|---|---|---|---|---|---|---|---|---|
| 1980's | 0 | 153 | 302 | |||||||
| 1990's | 341 | 278 | 239 | 132 | 265 | 688 | 199 | 235 | 412 | 589 |
| 2000's | 280 | 517 | 310 | 762 | 799 | 843 | 1,027 | 1,067 | 1,137 | 1,429 |
| 2010's | 1,748 | 1,973 | 2,007 | 1,969 | 1,832 | 1,933 | 1,989 | 1,991 | 2,042 | 2,230 |
| 2020's | 2,242 | 2,766 | 2,562 | 3,352 | 3,105 |
| - = No Data Reported; -- = Not Applicable; NA = Not Available; W = Withheld to avoid disclosure of individual company data. |
| Release Date: 6/30/2026 |
| Next Release Date: 7/31/2026 |