|
Download Data (XLS File) |
|
|||||
|
|||||
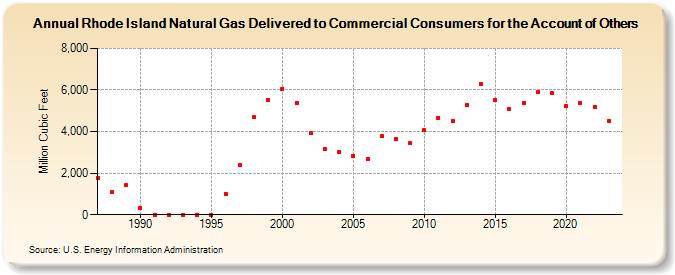
| Rhode Island Natural Gas Delivered to Commercial Consumers for the Account of Others (Million Cubic Feet) | |||||
| Decade | Year-0 | Year-1 | Year-2 | Year-3 | Year-4 | Year-5 | Year-6 | Year-7 | Year-8 | Year-9 |
|---|---|---|---|---|---|---|---|---|---|---|
| 1980's | 1,742 | 1,080 | 1,411 | |||||||
| 1990's | 330 | 0 | 0 | 0 | 0 | 0 | 1,010 | 2,405 | 4,679 | 5,524 |
| 2000's | 6,070 | 5,380 | 3,912 | 3,176 | 3,015 | 2,834 | 2,673 | 3,764 | 3,663 | 3,430 |
| 2010's | 4,062 | 4,669 | 4,503 | 5,288 | 6,295 | 5,531 | 5,069 | 5,350 | 5,922 | 5,833 |
| 2020's | 5,229 | 5,374 | 5,196 | 4,528 | 5,654 |
| - = No Data Reported; -- = Not Applicable; NA = Not Available; W = Withheld to avoid disclosure of individual company data. |
| Release Date: 6/30/2026 |
| Next Release Date: 7/31/2026 |