|
Download Data (XLS File) |
|
|||||
|
|||||
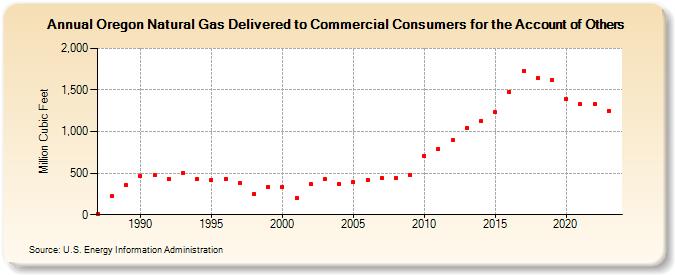
| Oregon Natural Gas Delivered to Commercial Consumers for the Account of Others (Million Cubic Feet) | |||||
| Decade | Year-0 | Year-1 | Year-2 | Year-3 | Year-4 | Year-5 | Year-6 | Year-7 | Year-8 | Year-9 |
|---|---|---|---|---|---|---|---|---|---|---|
| 1980's | 14 | 221 | 353 | |||||||
| 1990's | 464 | 477 | 433 | 504 | 430 | 419 | 431 | 378 | 254 | 337 |
| 2000's | 336 | 201 | 366 | 428 | 372 | 391 | 418 | 445 | 443 | 479 |
| 2010's | 707 | 790 | 895 | 1,044 | 1,129 | 1,231 | 1,480 | 1,733 | 1,643 | 1,617 |
| 2020's | 1,394 | 1,328 | 1,330 | 1,252 | 1,140 |
| - = No Data Reported; -- = Not Applicable; NA = Not Available; W = Withheld to avoid disclosure of individual company data. |
| Release Date: 6/30/2026 |
| Next Release Date: 7/31/2026 |