|
Download Data (XLS File) |
|
|||||
|
|||||
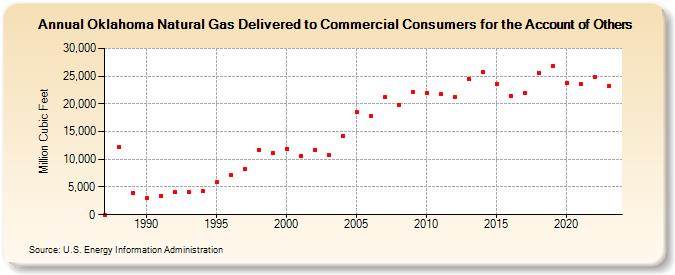
| Oklahoma Natural Gas Delivered to Commercial Consumers for the Account of Others (Million Cubic Feet) | |||||
| Decade | Year-0 | Year-1 | Year-2 | Year-3 | Year-4 | Year-5 | Year-6 | Year-7 | Year-8 | Year-9 |
|---|---|---|---|---|---|---|---|---|---|---|
| 1980's | 0 | 12,217 | 3,988 | |||||||
| 1990's | 2,944 | 3,445 | 4,052 | 4,095 | 4,214 | 5,894 | 7,165 | 8,204 | 11,752 | 11,218 |
| 2000's | 11,920 | 10,549 | 11,682 | 10,755 | 14,253 | 18,468 | 17,798 | 21,216 | 19,870 | 22,220 |
| 2010's | 21,966 | 21,697 | 21,258 | 24,494 | 25,705 | 23,577 | 21,488 | 21,864 | 25,577 | 26,867 |
| 2020's | 23,828 | 23,556 | 24,885 | 23,258 | 23,349 |
| - = No Data Reported; -- = Not Applicable; NA = Not Available; W = Withheld to avoid disclosure of individual company data. |
| Release Date: 6/30/2026 |
| Next Release Date: 7/31/2026 |