|
Download Data (XLS File) |
|
|||||
|
|||||
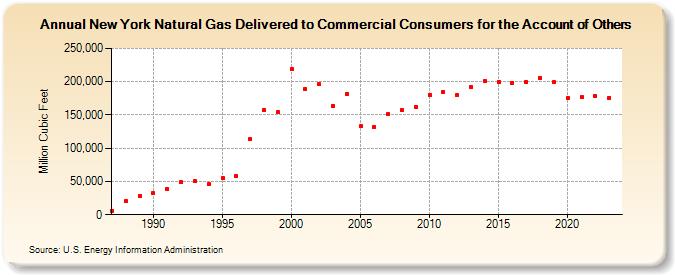
| New York Natural Gas Delivered to Commercial Consumers for the Account of Others (Million Cubic Feet) | |||||
| Decade | Year-0 | Year-1 | Year-2 | Year-3 | Year-4 | Year-5 | Year-6 | Year-7 | Year-8 | Year-9 |
|---|---|---|---|---|---|---|---|---|---|---|
| 1980's | 6,117 | 19,944 | 28,376 | |||||||
| 1990's | 31,904 | 38,556 | 48,552 | 50,279 | 45,626 | 55,135 | 58,135 | 113,408 | 157,319 | 154,004 |
| 2000's | 219,003 | 188,430 | 195,812 | 164,009 | 182,026 | 132,708 | 131,580 | 150,725 | 157,373 | 162,020 |
| 2010's | 180,573 | 184,262 | 179,436 | 192,189 | 200,776 | 199,841 | 198,385 | 199,225 | 206,234 | 199,130 |
| 2020's | 176,108 | 177,305 | 177,736 | 176,167 | 190,774 |
| - = No Data Reported; -- = Not Applicable; NA = Not Available; W = Withheld to avoid disclosure of individual company data. |
| Release Date: 6/30/2026 |
| Next Release Date: 7/31/2026 |