|
Download Data (XLS File) |
|
|||||
|
|||||
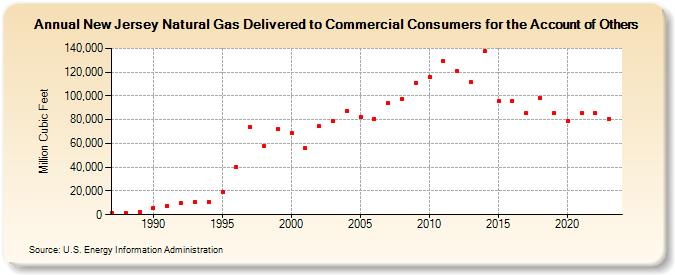
| New Jersey Natural Gas Delivered to Commercial Consumers for the Account of Others (Million Cubic Feet) | |||||
| Decade | Year-0 | Year-1 | Year-2 | Year-3 | Year-4 | Year-5 | Year-6 | Year-7 | Year-8 | Year-9 |
|---|---|---|---|---|---|---|---|---|---|---|
| 1980's | 1,186 | 1,558 | 2,578 | |||||||
| 1990's | 5,978 | 7,401 | 10,012 | 10,901 | 11,045 | 19,074 | 40,100 | 73,902 | 57,904 | 72,015 |
| 2000's | 68,383 | 55,889 | 74,340 | 78,718 | 87,596 | 82,294 | 80,976 | 94,231 | 97,638 | 111,224 |
| 2010's | 115,999 | 129,307 | 120,934 | 111,366 | 137,556 | 95,586 | 95,958 | 85,366 | 98,428 | 85,199 |
| 2020's | 78,850 | 85,617 | 85,676 | 80,791 | 78,123 |
| - = No Data Reported; -- = Not Applicable; NA = Not Available; W = Withheld to avoid disclosure of individual company data. |
| Release Date: 6/30/2026 |
| Next Release Date: 7/31/2026 |