|
Download Data (XLS File) |
|
|||||
|
|||||
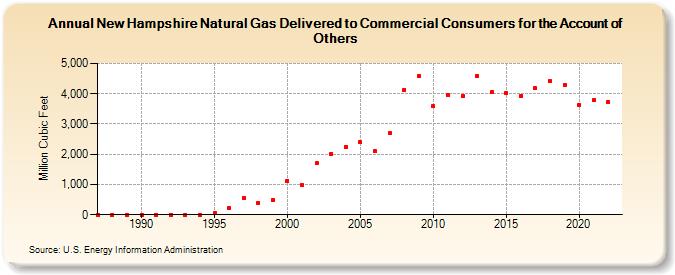
| New Hampshire Natural Gas Delivered to Commercial Consumers for the Account of Others (Million Cubic Feet) | |||||
| Decade | Year-0 | Year-1 | Year-2 | Year-3 | Year-4 | Year-5 | Year-6 | Year-7 | Year-8 | Year-9 |
|---|---|---|---|---|---|---|---|---|---|---|
| 1980's | 0 | 0 | 0 | |||||||
| 1990's | 0 | 0 | 0 | 0 | 0 | 52 | 218 | 567 | 399 | 490 |
| 2000's | 1,130 | 984 | 1,700 | 2,015 | 2,247 | 2,392 | 2,092 | 2,692 | 4,126 | 4,584 |
| 2010's | 3,588 | 3,949 | 3,917 | 4,585 | 4,049 | 4,008 | 3,941 | 4,174 | 4,416 | 4,290 |
| 2020's | 3,636 | 3,787 | 3,719 | 4,365 | 3,884 |
| - = No Data Reported; -- = Not Applicable; NA = Not Available; W = Withheld to avoid disclosure of individual company data. |
| Release Date: 6/30/2026 |
| Next Release Date: 7/31/2026 |