|
Download Data (XLS File) |
|
|||||
|
|||||
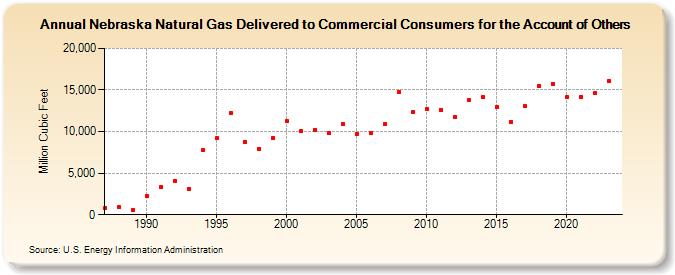
| Nebraska Natural Gas Delivered to Commercial Consumers for the Account of Others (Million Cubic Feet) | |||||
| Decade | Year-0 | Year-1 | Year-2 | Year-3 | Year-4 | Year-5 | Year-6 | Year-7 | Year-8 | Year-9 |
|---|---|---|---|---|---|---|---|---|---|---|
| 1980's | 786 | 894 | 571 | |||||||
| 1990's | 2,231 | 3,294 | 4,063 | 3,142 | 7,726 | 9,181 | 12,247 | 8,738 | 7,941 | 9,227 |
| 2000's | 11,235 | 10,083 | 10,230 | 9,820 | 10,892 | 9,728 | 9,795 | 10,851 | 14,792 | 12,292 |
| 2010's | 12,664 | 12,649 | 11,723 | 13,748 | 14,128 | 12,939 | 11,184 | 13,022 | 15,469 | 15,726 |
| 2020's | 14,122 | 14,158 | 14,621 | 16,136 | 15,826 |
| - = No Data Reported; -- = Not Applicable; NA = Not Available; W = Withheld to avoid disclosure of individual company data. |
| Release Date: 6/30/2026 |
| Next Release Date: 7/31/2026 |