|
Download Data (XLS File) |
|
|||||
|
|||||
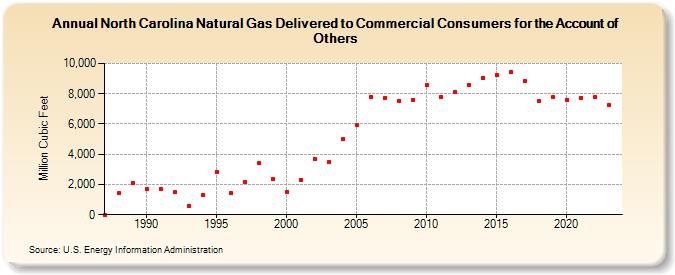
| North Carolina Natural Gas Delivered to Commercial Consumers for the Account of Others (Million Cubic Feet) | |||||
| Decade | Year-0 | Year-1 | Year-2 | Year-3 | Year-4 | Year-5 | Year-6 | Year-7 | Year-8 | Year-9 |
|---|---|---|---|---|---|---|---|---|---|---|
| 1980's | 4 | 1,424 | 2,126 | |||||||
| 1990's | 1,696 | 1,725 | 1,497 | 561 | 1,314 | 2,831 | 1,409 | 2,141 | 3,418 | 2,374 |
| 2000's | 1,511 | 2,327 | 3,685 | 3,461 | 5,002 | 5,920 | 7,794 | 7,712 | 7,518 | 7,610 |
| 2010's | 8,546 | 7,804 | 8,098 | 8,574 | 9,069 | 9,236 | 9,425 | 8,816 | 7,528 | 7,775 |
| 2020's | 7,560 | 7,739 | 7,758 | 7,247 | 6,079 |
| - = No Data Reported; -- = Not Applicable; NA = Not Available; W = Withheld to avoid disclosure of individual company data. |
| Release Date: 6/30/2026 |
| Next Release Date: 7/31/2026 |