|
Download Data (XLS File) |
|
|||||
|
|||||
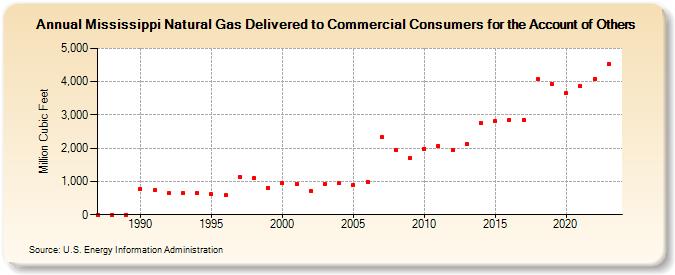
| Mississippi Natural Gas Delivered to Commercial Consumers for the Account of Others (Million Cubic Feet) | |||||
| Decade | Year-0 | Year-1 | Year-2 | Year-3 | Year-4 | Year-5 | Year-6 | Year-7 | Year-8 | Year-9 |
|---|---|---|---|---|---|---|---|---|---|---|
| 1980's | 0 | 0 | 0 | |||||||
| 1990's | 777 | 731 | 645 | 647 | 647 | 615 | 585 | 1,148 | 1,101 | 807 |
| 2000's | 954 | 935 | 707 | 937 | 943 | 895 | 993 | 2,327 | 1,942 | 1,715 |
| 2010's | 1,983 | 2,067 | 1,958 | 2,123 | 2,772 | 2,806 | 2,859 | 2,857 | 4,065 | 3,929 |
| 2020's | 3,646 | 3,872 | 4,073 | 4,540 | 4,633 |
| - = No Data Reported; -- = Not Applicable; NA = Not Available; W = Withheld to avoid disclosure of individual company data. |
| Release Date: 6/30/2026 |
| Next Release Date: 7/31/2026 |