|
Download Data (XLS File) |
|
|||||
|
|||||
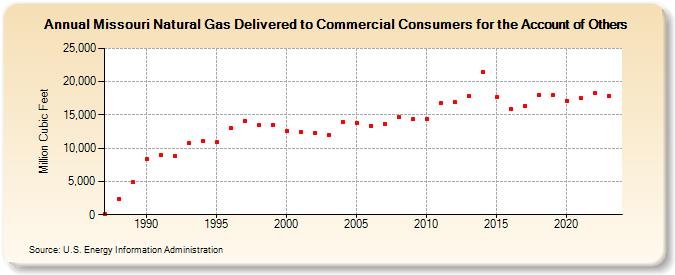
| Missouri Natural Gas Delivered to Commercial Consumers for the Account of Others (Million Cubic Feet) | |||||
| Decade | Year-0 | Year-1 | Year-2 | Year-3 | Year-4 | Year-5 | Year-6 | Year-7 | Year-8 | Year-9 |
|---|---|---|---|---|---|---|---|---|---|---|
| 1980's | 142 | 2,400 | 4,851 | |||||||
| 1990's | 8,306 | 8,910 | 8,817 | 10,710 | 11,072 | 10,880 | 12,988 | 14,059 | 13,463 | 13,494 |
| 2000's | 12,512 | 12,447 | 12,349 | 12,000 | 13,965 | 13,823 | 13,373 | 13,653 | 14,628 | 14,325 |
| 2010's | 14,387 | 16,750 | 16,876 | 17,894 | 21,481 | 17,663 | 15,879 | 16,401 | 17,964 | 17,921 |
| 2020's | 17,093 | 17,504 | 18,240 | 17,913 | 17,833 |
| - = No Data Reported; -- = Not Applicable; NA = Not Available; W = Withheld to avoid disclosure of individual company data. |
| Release Date: 6/30/2026 |
| Next Release Date: 7/31/2026 |