|
Download Data (XLS File) |
|
|||||
|
|||||
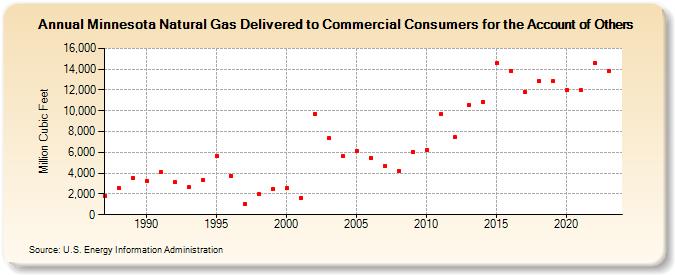
| Minnesota Natural Gas Delivered to Commercial Consumers for the Account of Others (Million Cubic Feet) | |||||
| Decade | Year-0 | Year-1 | Year-2 | Year-3 | Year-4 | Year-5 | Year-6 | Year-7 | Year-8 | Year-9 |
|---|---|---|---|---|---|---|---|---|---|---|
| 1980's | 1,845 | 2,524 | 3,527 | |||||||
| 1990's | 3,220 | 4,094 | 3,134 | 2,623 | 3,336 | 5,696 | 3,768 | 1,077 | 1,954 | 2,454 |
| 2000's | 2,529 | 1,634 | 9,684 | 7,353 | 5,627 | 6,165 | 5,472 | 4,691 | 4,251 | 6,069 |
| 2010's | 6,224 | 9,668 | 7,429 | 10,508 | 10,835 | 14,581 | 13,829 | 11,828 | 12,860 | 12,834 |
| 2020's | 11,996 | 11,961 | 14,577 | 13,866 | 13,484 |
| - = No Data Reported; -- = Not Applicable; NA = Not Available; W = Withheld to avoid disclosure of individual company data. |
| Release Date: 6/30/2026 |
| Next Release Date: 7/31/2026 |