|
Download Data (XLS File) |
|
|||||
|
|||||
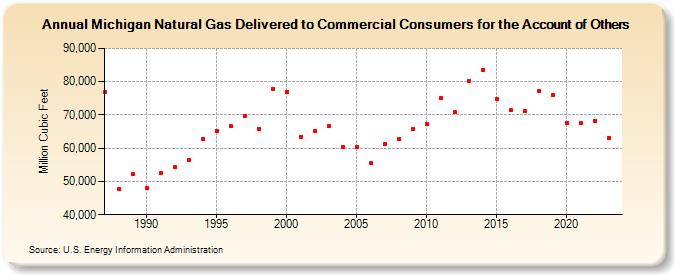
| Michigan Natural Gas Delivered to Commercial Consumers for the Account of Others (Million Cubic Feet) | |||||
| Decade | Year-0 | Year-1 | Year-2 | Year-3 | Year-4 | Year-5 | Year-6 | Year-7 | Year-8 | Year-9 |
|---|---|---|---|---|---|---|---|---|---|---|
| 1980's | 76,846 | 47,678 | 52,120 | |||||||
| 1990's | 48,061 | 52,444 | 54,248 | 56,547 | 62,825 | 65,266 | 66,621 | 69,739 | 65,843 | 77,782 |
| 2000's | 76,988 | 63,501 | 65,295 | 66,689 | 60,299 | 60,424 | 55,425 | 61,384 | 62,704 | 65,685 |
| 2010's | 67,402 | 75,019 | 70,845 | 80,247 | 83,474 | 74,670 | 71,350 | 71,297 | 77,117 | 76,022 |
| 2020's | 67,593 | 67,534 | 68,160 | 63,146 | 59,706 |
| - = No Data Reported; -- = Not Applicable; NA = Not Available; W = Withheld to avoid disclosure of individual company data. |
| Release Date: 6/30/2026 |
| Next Release Date: 7/31/2026 |