|
Download Data (XLS File) |
|
|||||
|
|||||
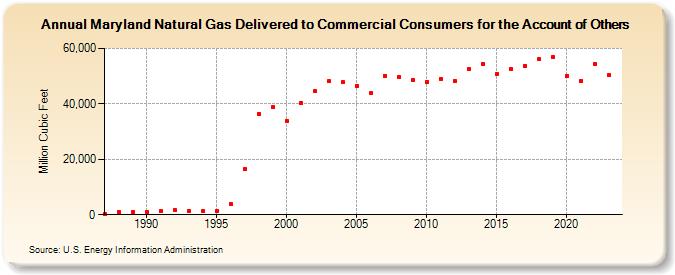
| Maryland Natural Gas Delivered to Commercial Consumers for the Account of Others (Million Cubic Feet) | |||||
| Decade | Year-0 | Year-1 | Year-2 | Year-3 | Year-4 | Year-5 | Year-6 | Year-7 | Year-8 | Year-9 |
|---|---|---|---|---|---|---|---|---|---|---|
| 1980's | 262 | 800 | 1,010 | |||||||
| 1990's | 1,052 | 1,308 | 1,692 | 1,497 | 1,291 | 1,469 | 3,734 | 16,394 | 36,375 | 38,722 |
| 2000's | 33,880 | 40,313 | 44,577 | 48,105 | 47,747 | 46,440 | 43,744 | 50,220 | 49,545 | 48,717 |
| 2010's | 48,000 | 49,053 | 48,271 | 52,494 | 54,411 | 50,836 | 52,386 | 53,676 | 56,131 | 56,938 |
| 2020's | 50,126 | 48,382 | 54,465 | 50,228 | 51,458 |
| - = No Data Reported; -- = Not Applicable; NA = Not Available; W = Withheld to avoid disclosure of individual company data. |
| Release Date: 6/30/2026 |
| Next Release Date: 7/31/2026 |