|
Download Data (XLS File) |
|
|||||
|
|||||
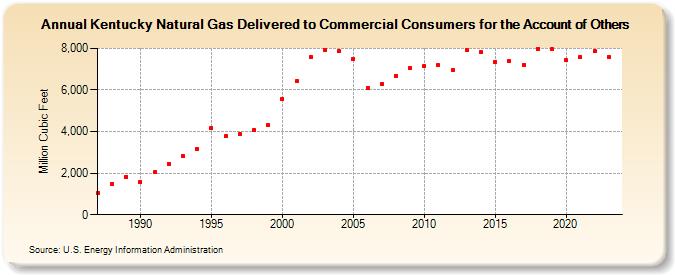
| Kentucky Natural Gas Delivered to Commercial Consumers for the Account of Others (Million Cubic Feet) | |||||
| Decade | Year-0 | Year-1 | Year-2 | Year-3 | Year-4 | Year-5 | Year-6 | Year-7 | Year-8 | Year-9 |
|---|---|---|---|---|---|---|---|---|---|---|
| 1980's | 1,053 | 1,501 | 1,828 | |||||||
| 1990's | 1,575 | 2,035 | 2,451 | 2,809 | 3,171 | 4,169 | 3,773 | 3,860 | 4,076 | 4,315 |
| 2000's | 5,584 | 6,424 | 7,590 | 7,942 | 7,864 | 7,488 | 6,092 | 6,304 | 6,673 | 7,047 |
| 2010's | 7,163 | 7,188 | 6,941 | 7,919 | 7,819 | 7,361 | 7,372 | 7,215 | 7,983 | 7,954 |
| 2020's | 7,421 | 7,576 | 7,869 | 7,590 | 7,641 |
| - = No Data Reported; -- = Not Applicable; NA = Not Available; W = Withheld to avoid disclosure of individual company data. |
| Release Date: 6/30/2026 |
| Next Release Date: 7/31/2026 |