|
Download Data (XLS File) |
|
|||||
|
|||||
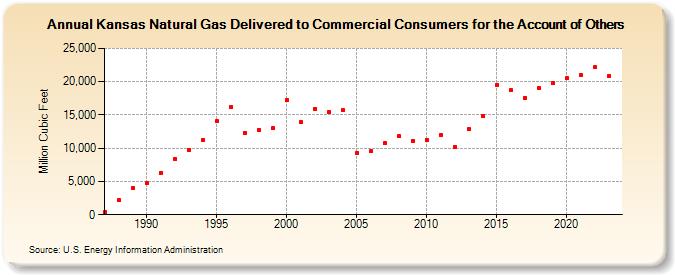
| Kansas Natural Gas Delivered to Commercial Consumers for the Account of Others (Million Cubic Feet) | |||||
| Decade | Year-0 | Year-1 | Year-2 | Year-3 | Year-4 | Year-5 | Year-6 | Year-7 | Year-8 | Year-9 |
|---|---|---|---|---|---|---|---|---|---|---|
| 1980's | 383 | 2,193 | 4,037 | |||||||
| 1990's | 4,701 | 6,321 | 8,408 | 9,729 | 11,295 | 14,029 | 16,200 | 12,331 | 12,757 | 12,985 |
| 2000's | 17,198 | 13,871 | 15,933 | 15,462 | 15,719 | 9,330 | 9,518 | 10,757 | 11,760 | 11,153 |
| 2010's | 11,288 | 12,008 | 10,239 | 12,829 | 14,843 | 19,508 | 18,685 | 17,595 | 19,017 | 19,801 |
| 2020's | 20,526 | 21,050 | 22,135 | 20,824 | 20,217 |
| - = No Data Reported; -- = Not Applicable; NA = Not Available; W = Withheld to avoid disclosure of individual company data. |
| Release Date: 6/30/2026 |
| Next Release Date: 7/31/2026 |