|
Download Data (XLS File) |
|
|||||
|
|||||
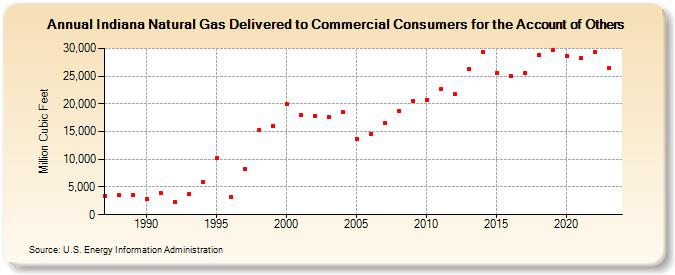
| Indiana Natural Gas Delivered to Commercial Consumers for the Account of Others (Million Cubic Feet) | |||||
| Decade | Year-0 | Year-1 | Year-2 | Year-3 | Year-4 | Year-5 | Year-6 | Year-7 | Year-8 | Year-9 |
|---|---|---|---|---|---|---|---|---|---|---|
| 1980's | 3,453 | 3,473 | 3,579 | |||||||
| 1990's | 2,906 | 3,947 | 2,319 | 3,724 | 5,841 | 10,149 | 3,255 | 8,290 | 15,216 | 15,967 |
| 2000's | 19,921 | 17,990 | 17,844 | 17,615 | 18,539 | 13,662 | 14,610 | 16,566 | 18,768 | 20,579 |
| 2010's | 20,742 | 22,652 | 21,758 | 26,298 | 29,437 | 25,572 | 24,970 | 25,565 | 28,803 | 29,706 |
| 2020's | 28,577 | 28,311 | 29,287 | 26,462 | 26,398 |
| - = No Data Reported; -- = Not Applicable; NA = Not Available; W = Withheld to avoid disclosure of individual company data. |
| Release Date: 5/29/2026 |
| Next Release Date: 6/30/2026 |