|
Download Data (XLS File) |
|
|||||
|
|||||
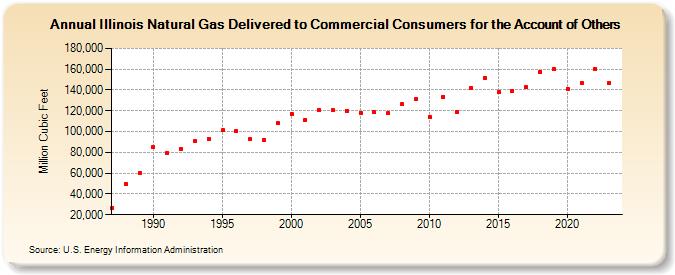
| Illinois Natural Gas Delivered to Commercial Consumers for the Account of Others (Million Cubic Feet) | |||||
| Decade | Year-0 | Year-1 | Year-2 | Year-3 | Year-4 | Year-5 | Year-6 | Year-7 | Year-8 | Year-9 |
|---|---|---|---|---|---|---|---|---|---|---|
| 1980's | 26,117 | 49,942 | 60,159 | |||||||
| 1990's | 84,936 | 79,512 | 83,264 | 90,812 | 93,206 | 101,211 | 100,495 | 92,730 | 91,872 | 107,830 |
| 2000's | 117,228 | 111,421 | 120,931 | 120,455 | 120,031 | 118,168 | 118,383 | 117,571 | 126,178 | 130,862 |
| 2010's | 114,430 | 133,561 | 118,946 | 142,228 | 151,386 | 138,090 | 139,325 | 142,396 | 157,378 | 160,147 |
| 2020's | 141,397 | 147,015 | 160,276 | 146,997 | 140,973 |
| - = No Data Reported; -- = Not Applicable; NA = Not Available; W = Withheld to avoid disclosure of individual company data. |
| Release Date: 6/30/2026 |
| Next Release Date: 7/31/2026 |