|
Download Data (XLS File) |
|
|||||
|
|||||
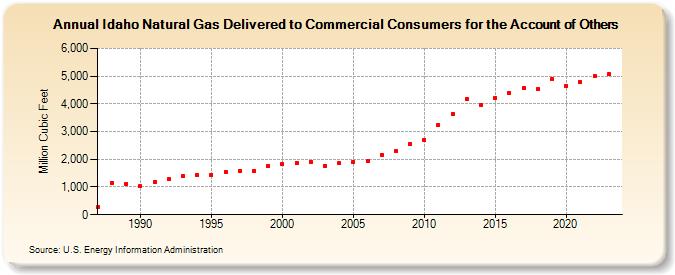
| Idaho Natural Gas Delivered to Commercial Consumers for the Account of Others (Million Cubic Feet) | |||||
| Decade | Year-0 | Year-1 | Year-2 | Year-3 | Year-4 | Year-5 | Year-6 | Year-7 | Year-8 | Year-9 |
|---|---|---|---|---|---|---|---|---|---|---|
| 1980's | 284 | 1,161 | 1,121 | |||||||
| 1990's | 1,035 | 1,192 | 1,278 | 1,405 | 1,427 | 1,450 | 1,543 | 1,593 | 1,594 | 1,773 |
| 2000's | 1,838 | 1,866 | 1,912 | 1,775 | 1,858 | 1,911 | 1,927 | 2,169 | 2,285 | 2,560 |
| 2010's | 2,713 | 3,236 | 3,644 | 4,181 | 3,974 | 4,228 | 4,406 | 4,573 | 4,541 | 4,891 |
| 2020's | 4,659 | 4,790 | 4,986 | 5,068 | 8,766 |
| - = No Data Reported; -- = Not Applicable; NA = Not Available; W = Withheld to avoid disclosure of individual company data. |
| Release Date: 6/30/2026 |
| Next Release Date: 7/31/2026 |