|
Download Data (XLS File) |
|
|||||
|
|||||
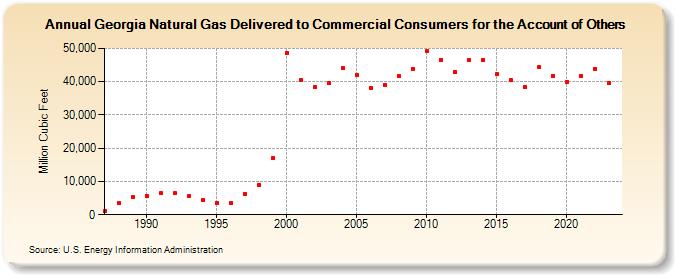
| Georgia Natural Gas Delivered to Commercial Consumers for the Account of Others (Million Cubic Feet) | |||||
| Decade | Year-0 | Year-1 | Year-2 | Year-3 | Year-4 | Year-5 | Year-6 | Year-7 | Year-8 | Year-9 |
|---|---|---|---|---|---|---|---|---|---|---|
| 1980's | 1,067 | 3,418 | 5,176 | |||||||
| 1990's | 5,721 | 6,395 | 6,389 | 5,487 | 4,304 | 3,663 | 3,646 | 6,211 | 9,078 | 16,996 |
| 2000's | 48,726 | 40,531 | 38,395 | 39,611 | 44,025 | 42,112 | 38,204 | 38,967 | 41,555 | 43,845 |
| 2010's | 49,157 | 46,512 | 42,971 | 46,494 | 46,526 | 42,181 | 40,350 | 38,536 | 44,296 | 41,734 |
| 2020's | 39,981 | 41,668 | 43,917 | 39,598 | 43,052 |
| - = No Data Reported; -- = Not Applicable; NA = Not Available; W = Withheld to avoid disclosure of individual company data. |
| Release Date: 6/30/2026 |
| Next Release Date: 7/31/2026 |