|
Download Data (XLS File) |
|
|||||
|
|||||
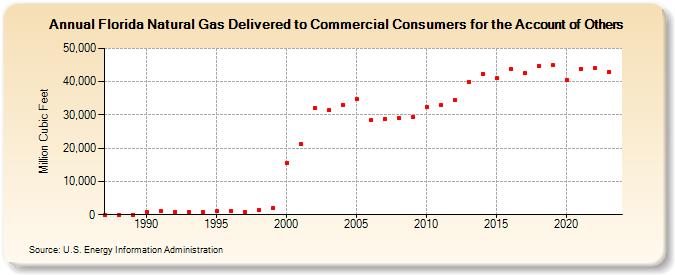
| Florida Natural Gas Delivered to Commercial Consumers for the Account of Others (Million Cubic Feet) | |||||
| Decade | Year-0 | Year-1 | Year-2 | Year-3 | Year-4 | Year-5 | Year-6 | Year-7 | Year-8 | Year-9 |
|---|---|---|---|---|---|---|---|---|---|---|
| 1980's | 0 | 0 | 0 | |||||||
| 1990's | 881 | 1,005 | 964 | 911 | 861 | 988 | 1,204 | 932 | 1,281 | 1,998 |
| 2000's | 15,603 | 21,386 | 32,213 | 31,333 | 33,106 | 34,682 | 28,398 | 28,805 | 29,046 | 29,414 |
| 2010's | 32,313 | 32,940 | 34,441 | 39,987 | 42,437 | 41,036 | 43,688 | 42,665 | 44,676 | 44,886 |
| 2020's | 40,638 | 43,889 | 43,959 | 42,989 | 46,267 |
| - = No Data Reported; -- = Not Applicable; NA = Not Available; W = Withheld to avoid disclosure of individual company data. |
| Release Date: 6/30/2026 |
| Next Release Date: 7/31/2026 |