|
Download Data (XLS File) |
|
|||||
|
|||||
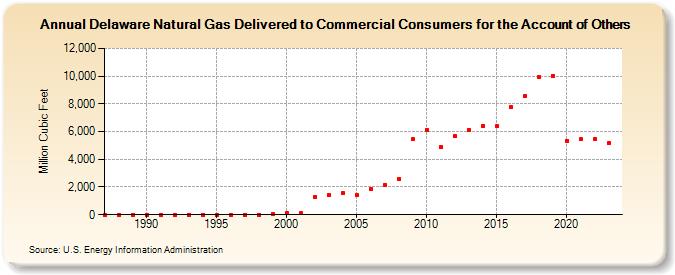
| Delaware Natural Gas Delivered to Commercial Consumers for the Account of Others (Million Cubic Feet) | |||||
| Decade | Year-0 | Year-1 | Year-2 | Year-3 | Year-4 | Year-5 | Year-6 | Year-7 | Year-8 | Year-9 |
|---|---|---|---|---|---|---|---|---|---|---|
| 1980's | 0 | 0 | 0 | |||||||
| 1990's | 0 | 0 | 0 | 0 | 0 | 0 | 0 | 0 | 0 | 75 |
| 2000's | 103 | 97 | 1,285 | 1,450 | 1,561 | 1,399 | 1,833 | 2,178 | 2,611 | 5,438 |
| 2010's | 6,117 | 4,879 | 5,647 | 6,146 | 6,389 | 6,367 | 7,748 | 8,560 | 9,945 | 10,018 |
| 2020's | 5,344 | 5,435 | 5,465 | 5,167 | 5,373 |
| - = No Data Reported; -- = Not Applicable; NA = Not Available; W = Withheld to avoid disclosure of individual company data. |
| Release Date: 6/30/2026 |
| Next Release Date: 7/31/2026 |