|
Download Data (XLS File) |
|
|||||
|
|||||
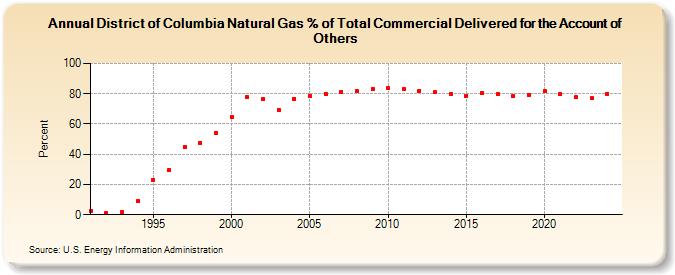
| District of Columbia Natural Gas % of Total Commercial Delivered for the Account of Others (Percent) | |||||
| Decade | Year-0 | Year-1 | Year-2 | Year-3 | Year-4 | Year-5 | Year-6 | Year-7 | Year-8 | Year-9 |
|---|---|---|---|---|---|---|---|---|---|---|
| 1990's | 2.7 | 1.0 | 2.0 | 9.1 | 23.2 | 29.5 | 45.1 | 47.7 | 54.1 | |
| 2000's | 64.4 | 77.6 | 76.5 | 69.5 | 76.7 | 78.6 | 80.1 | 81.4 | 82.1 | 83.1 |
| 2010's | 83.6 | 83.1 | 82.1 | 80.9 | 80.1 | 78.6 | 80.5 | 79.9 | 78.3 | 79.3 |
| 2020's | 81.6 | 79.5 | 77.6 | 77.1 | 80.1 |
| - = No Data Reported; -- = Not Applicable; NA = Not Available; W = Withheld to avoid disclosure of individual company data. |
| Release Date: 6/30/2026 |
| Next Release Date: 7/31/2026 |