|
Download Data (XLS File) |
|
|||||
|
|||||
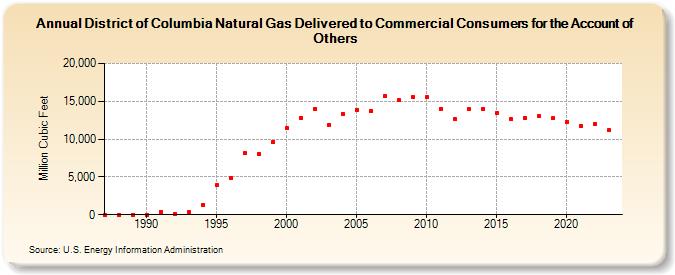
| District of Columbia Natural Gas Delivered to Commercial Consumers for the Account of Others (Million Cubic Feet) | |||||
| Decade | Year-0 | Year-1 | Year-2 | Year-3 | Year-4 | Year-5 | Year-6 | Year-7 | Year-8 | Year-9 |
|---|---|---|---|---|---|---|---|---|---|---|
| 1980's | 0 | 0 | 0 | |||||||
| 1990's | 0 | 417 | 155 | 332 | 1,343 | 3,954 | 4,823 | 8,122 | 8,045 | 9,644 |
| 2000's | 11,420 | 12,848 | 14,028 | 11,879 | 13,327 | 13,893 | 13,695 | 15,703 | 15,110 | 15,550 |
| 2010's | 15,507 | 14,029 | 12,614 | 13,942 | 14,022 | 13,456 | 12,602 | 12,819 | 13,014 | 12,779 |
| 2020's | 12,296 | 11,731 | 12,024 | 11,163 | 11,424 |
| - = No Data Reported; -- = Not Applicable; NA = Not Available; W = Withheld to avoid disclosure of individual company data. |
| Release Date: 6/30/2026 |
| Next Release Date: 7/31/2026 |