|
Download Data (XLS File) |
|
|||||
|
|||||
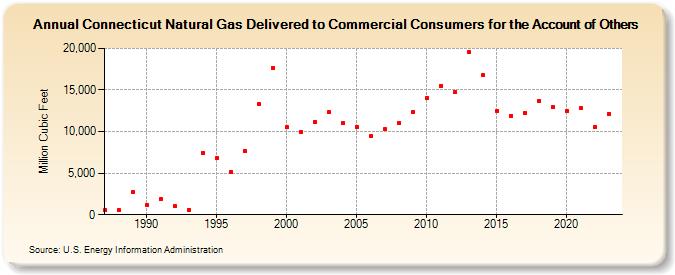
| Connecticut Natural Gas Delivered to Commercial Consumers for the Account of Others (Million Cubic Feet) | |||||
| Decade | Year-0 | Year-1 | Year-2 | Year-3 | Year-4 | Year-5 | Year-6 | Year-7 | Year-8 | Year-9 |
|---|---|---|---|---|---|---|---|---|---|---|
| 1980's | 533 | 513 | 2,680 | |||||||
| 1990's | 1,169 | 1,887 | 1,037 | 602 | 7,455 | 6,836 | 5,193 | 7,709 | 13,270 | 17,692 |
| 2000's | 10,509 | 9,953 | 11,188 | 12,350 | 11,013 | 10,606 | 9,458 | 10,252 | 11,032 | 12,324 |
| 2010's | 14,068 | 15,519 | 14,774 | 19,561 | 16,799 | 12,515 | 11,917 | 12,266 | 13,714 | 12,925 |
| 2020's | 12,477 | 12,780 | 10,569 | 12,154 | 13,872 |
| - = No Data Reported; -- = Not Applicable; NA = Not Available; W = Withheld to avoid disclosure of individual company data. |
| Release Date: 6/30/2026 |
| Next Release Date: 7/31/2026 |