|
Download Data (XLS File) |
|
|||||
|
|||||
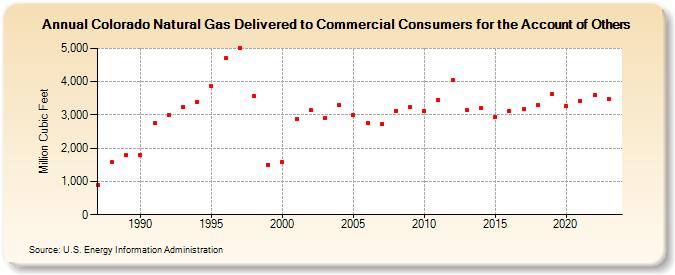
| Colorado Natural Gas Delivered to Commercial Consumers for the Account of Others (Million Cubic Feet) | |||||
| Decade | Year-0 | Year-1 | Year-2 | Year-3 | Year-4 | Year-5 | Year-6 | Year-7 | Year-8 | Year-9 |
|---|---|---|---|---|---|---|---|---|---|---|
| 1980's | 898 | 1,574 | 1,789 | |||||||
| 1990's | 1,800 | 2,763 | 2,993 | 3,241 | 3,403 | 3,863 | 4,702 | 4,998 | 3,573 | 1,508 |
| 2000's | 1,584 | 2,889 | 3,139 | 2,918 | 3,299 | 3,010 | 2,772 | 2,721 | 3,132 | 3,240 |
| 2010's | 3,118 | 3,457 | 4,061 | 3,142 | 3,199 | 2,937 | 3,104 | 3,169 | 3,301 | 3,616 |
| 2020's | 3,273 | 3,415 | 3,595 | 3,492 | 3,171 |
| - = No Data Reported; -- = Not Applicable; NA = Not Available; W = Withheld to avoid disclosure of individual company data. |
| Release Date: 6/30/2026 |
| Next Release Date: 7/31/2026 |