|
Download Data (XLS File) |
|
|||||
|
|||||
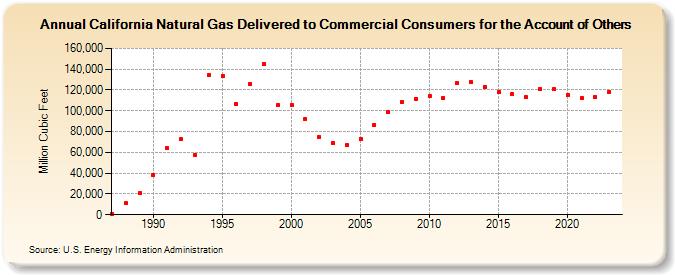
| California Natural Gas Delivered to Commercial Consumers for the Account of Others (Million Cubic Feet) | |||||
| Decade | Year-0 | Year-1 | Year-2 | Year-3 | Year-4 | Year-5 | Year-6 | Year-7 | Year-8 | Year-9 |
|---|---|---|---|---|---|---|---|---|---|---|
| 1980's | 894 | 10,862 | 21,109 | |||||||
| 1990's | 38,337 | 63,882 | 72,782 | 57,781 | 134,346 | 133,483 | 106,531 | 125,836 | 144,864 | 105,079 |
| 2000's | 105,650 | 92,011 | 74,767 | 69,072 | 66,778 | 72,999 | 86,196 | 98,776 | 108,738 | 111,702 |
| 2010's | 113,903 | 112,448 | 126,571 | 127,588 | 122,637 | 118,219 | 115,959 | 112,875 | 120,738 | 120,640 |
| 2020's | 115,319 | 112,124 | 113,017 | 118,102 | 155,752 |
| - = No Data Reported; -- = Not Applicable; NA = Not Available; W = Withheld to avoid disclosure of individual company data. |
| Release Date: 6/30/2026 |
| Next Release Date: 7/31/2026 |