|
Download Data (XLS File) |
|
|||||
|
|||||
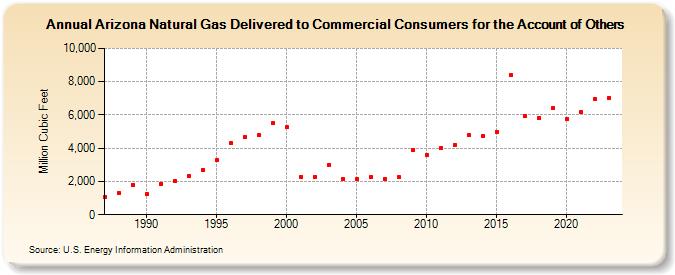
| Arizona Natural Gas Delivered to Commercial Consumers for the Account of Others (Million Cubic Feet) | |||||
| Decade | Year-0 | Year-1 | Year-2 | Year-3 | Year-4 | Year-5 | Year-6 | Year-7 | Year-8 | Year-9 |
|---|---|---|---|---|---|---|---|---|---|---|
| 1980's | 1,094 | 1,311 | 1,796 | |||||||
| 1990's | 1,219 | 1,876 | 2,021 | 2,336 | 2,709 | 3,282 | 4,309 | 4,662 | 4,777 | 5,485 |
| 2000's | 5,254 | 2,297 | 2,295 | 3,003 | 2,153 | 2,140 | 2,261 | 2,172 | 2,258 | 3,866 |
| 2010's | 3,605 | 3,988 | 4,213 | 4,772 | 4,743 | 4,992 | 8,396 | 5,912 | 5,811 | 6,411 |
| 2020's | 5,763 | 6,164 | 6,963 | 7,030 | 7,133 |
| - = No Data Reported; -- = Not Applicable; NA = Not Available; W = Withheld to avoid disclosure of individual company data. |
| Release Date: 6/30/2026 |
| Next Release Date: 7/31/2026 |