|
Download Data (XLS File) |
|
|||||
|
|||||
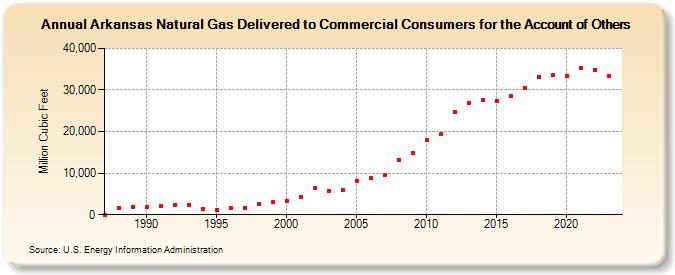
| Arkansas Natural Gas Delivered to Commercial Consumers for the Account of Others (Million Cubic Feet) | |||||
| Decade | Year-0 | Year-1 | Year-2 | Year-3 | Year-4 | Year-5 | Year-6 | Year-7 | Year-8 | Year-9 |
|---|---|---|---|---|---|---|---|---|---|---|
| 1980's | 0 | 1,723 | 1,870 | |||||||
| 1990's | 1,939 | 2,198 | 2,343 | 2,393 | 1,351 | 1,104 | 1,550 | 1,699 | 2,576 | 2,983 |
| 2000's | 3,354 | 4,164 | 6,336 | 5,751 | 5,874 | 8,173 | 8,843 | 9,534 | 13,112 | 14,776 |
| 2010's | 17,862 | 19,402 | 24,772 | 26,797 | 27,604 | 27,415 | 28,537 | 30,417 | 33,216 | 33,483 |
| 2020's | 33,458 | 35,185 | 34,873 | 33,372 | 33,319 |
| - = No Data Reported; -- = Not Applicable; NA = Not Available; W = Withheld to avoid disclosure of individual company data. |
| Release Date: 5/29/2026 |
| Next Release Date: 6/30/2026 |