|
Download Data (XLS File) |
|
|||||
|
|||||
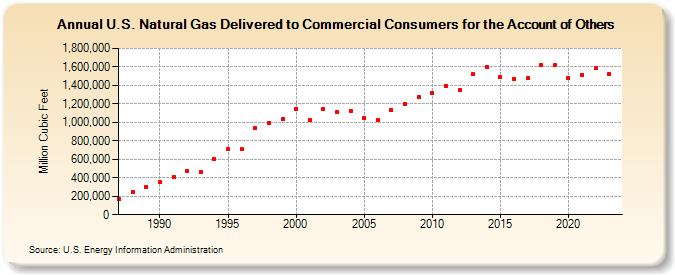
| U.S. Natural Gas Delivered to Commercial Consumers for the Account of Others (Million Cubic Feet) | |||||
| Decade | Year-0 | Year-1 | Year-2 | Year-3 | Year-4 | Year-5 | Year-6 | Year-7 | Year-8 | Year-9 |
|---|---|---|---|---|---|---|---|---|---|---|
| 1980's | 167,413 | 247,051 | 295,604 | |||||||
| 1990's | 352,521 | 405,919 | 471,009 | 460,097 | 599,058 | 706,139 | 706,667 | 939,332 | 990,265 | 1,031,794 |
| 2000's | 1,147,565 | 1,026,557 | 1,144,456 | 1,109,648 | 1,124,212 | 1,049,990 | 1,028,248 | 1,132,106 | 1,201,169 | 1,273,058 |
| 2010's | 1,317,138 | 1,394,183 | 1,354,780 | 1,519,352 | 1,600,088 | 1,490,944 | 1,473,824 | 1,478,318 | 1,616,830 | 1,615,853 |
| 2020's | 1,478,290 | 1,516,058 | 1,585,571 | 1,522,391 | 1,567,302 |
| - = No Data Reported; -- = Not Applicable; NA = Not Available; W = Withheld to avoid disclosure of individual company data. |
| Release Date: 6/30/2026 |
| Next Release Date: 7/31/2026 |