|
Download Data (XLS File) |
|
|||||
|
|||||
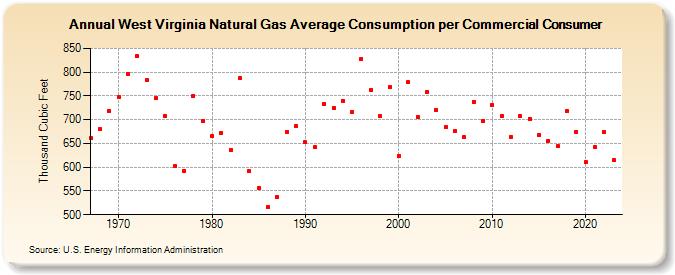
| West Virginia Natural Gas Average Consumption per Commercial Consumer (Thousand Cubic Feet) | |||||
| Decade | Year-0 | Year-1 | Year-2 | Year-3 | Year-4 | Year-5 | Year-6 | Year-7 | Year-8 | Year-9 |
|---|---|---|---|---|---|---|---|---|---|---|
| 1960's | 661 | 680 | 718 | |||||||
| 1970's | 748 | 797 | 833 | 783 | 745 | 708 | 602 | 593 | 750 | 698 |
| 1980's | 666 | 672 | 637 | 787 | 591 | 556 | 516 | 537 | 675 | 686 |
| 1990's | 652 | 642 | 734 | 725 | 740 | 716 | 828 | 763 | 707 | 769 |
| 2000's | 624 | 779 | 706 | 759 | 721 | 685 | 676 | 663 | 738 | 698 |
| 2010's | 731 | 708 | 664 | 707 | 702 | 668 | 656 | 644 | 718 | 675 |
| 2020's | 610 | 643 | 674 | 612 | 611 |
| - = No Data Reported; -- = Not Applicable; NA = Not Available; W = Withheld to avoid disclosure of individual company data. |
| Release Date: 6/30/2026 |
| Next Release Date: 7/31/2026 |