|
Download Data (XLS File) |
|
|||||
|
|||||
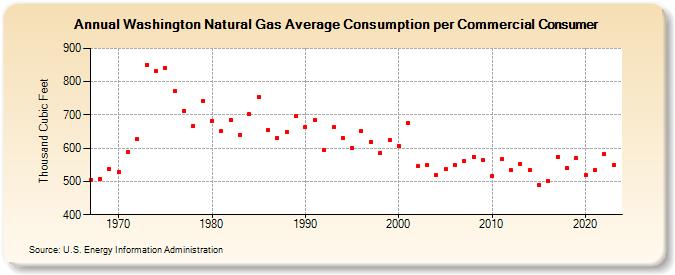
| Washington Natural Gas Average Consumption per Commercial Consumer (Thousand Cubic Feet) | |||||
| Decade | Year-0 | Year-1 | Year-2 | Year-3 | Year-4 | Year-5 | Year-6 | Year-7 | Year-8 | Year-9 |
|---|---|---|---|---|---|---|---|---|---|---|
| 1960's | 504 | 508 | 536 | |||||||
| 1970's | 528 | 589 | 628 | 851 | 831 | 842 | 772 | 713 | 667 | 742 |
| 1980's | 683 | 651 | 686 | 641 | 702 | 754 | 654 | 630 | 649 | 697 |
| 1990's | 665 | 686 | 596 | 663 | 631 | 601 | 653 | 618 | 586 | 626 |
| 2000's | 607 | 675 | 545 | 549 | 518 | 538 | 548 | 562 | 575 | 563 |
| 2010's | 517 | 567 | 534 | 553 | 535 | 488 | 500 | 575 | 540 | 571 |
| 2020's | 518 | 534 | 582 | 550 | 540 |
| - = No Data Reported; -- = Not Applicable; NA = Not Available; W = Withheld to avoid disclosure of individual company data. |
| Release Date: 3/31/2026 |
| Next Release Date: 4/30/2026 |