|
Download Data (XLS File) |
|
|||||
|
|||||
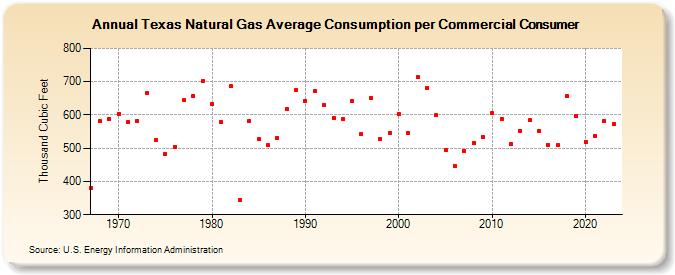
| Texas Natural Gas Average Consumption per Commercial Consumer (Thousand Cubic Feet) | |||||
| Decade | Year-0 | Year-1 | Year-2 | Year-3 | Year-4 | Year-5 | Year-6 | Year-7 | Year-8 | Year-9 |
|---|---|---|---|---|---|---|---|---|---|---|
| 1960's | 381 | 581 | 589 | |||||||
| 1970's | 604 | 579 | 581 | 666 | 525 | 484 | 505 | 645 | 657 | 702 |
| 1980's | 634 | 578 | 686 | 344 | 582 | 527 | 510 | 531 | 617 | 676 |
| 1990's | 643 | 672 | 630 | 592 | 588 | 643 | 542 | 651 | 529 | 546 |
| 2000's | 603 | 546 | 713 | 681 | 599 | 495 | 447 | 493 | 515 | 534 |
| 2010's | 605 | 587 | 512 | 553 | 584 | 552 | 511 | 510 | 656 | 597 |
| 2020's | 520 | 538 | 581 | 567 | 564 |
| - = No Data Reported; -- = Not Applicable; NA = Not Available; W = Withheld to avoid disclosure of individual company data. |
| Release Date: 6/30/2026 |
| Next Release Date: 7/31/2026 |