|
Download Data (XLS File) |
|
|||||
|
|||||
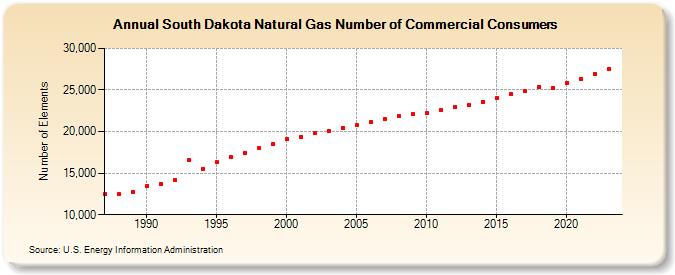
| South Dakota Natural Gas Number of Commercial Consumers (Number of Elements) | |||||
| Decade | Year-0 | Year-1 | Year-2 | Year-3 | Year-4 | Year-5 | Year-6 | Year-7 | Year-8 | Year-9 |
|---|---|---|---|---|---|---|---|---|---|---|
| 1980's | 12,480 | 12,438 | 12,771 | |||||||
| 1990's | 13,443 | 13,692 | 14,133 | 16,523 | 15,539 | 16,285 | 16,880 | 17,432 | 17,972 | 18,453 |
| 2000's | 19,100 | 19,378 | 19,794 | 20,070 | 20,457 | 20,771 | 21,149 | 21,502 | 21,819 | 22,071 |
| 2010's | 22,267 | 22,570 | 22,955 | 23,214 | 23,591 | 24,040 | 24,541 | 24,922 | 25,339 | 25,290 |
| 2020's | 25,846 | 26,359 | 26,957 | 27,482 | 28,125 |
| - = No Data Reported; -- = Not Applicable; NA = Not Available; W = Withheld to avoid disclosure of individual company data. |
| Release Date: 6/30/2026 |
| Next Release Date: 7/31/2026 |