|
Download Data (XLS File) |
|
|||||
|
|||||
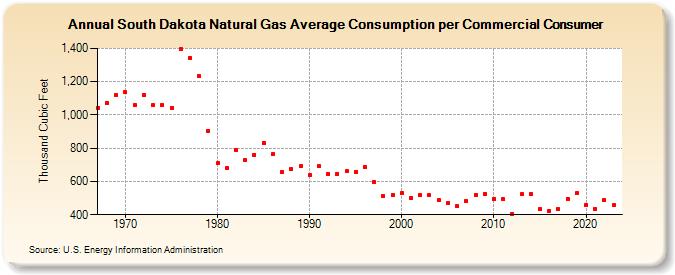
| South Dakota Natural Gas Average Consumption per Commercial Consumer (Thousand Cubic Feet) | |||||
| Decade | Year-0 | Year-1 | Year-2 | Year-3 | Year-4 | Year-5 | Year-6 | Year-7 | Year-8 | Year-9 |
|---|---|---|---|---|---|---|---|---|---|---|
| 1960's | 1,044 | 1,072 | 1,120 | |||||||
| 1970's | 1,136 | 1,059 | 1,120 | 1,057 | 1,061 | 1,044 | 1,395 | 1,344 | 1,232 | 905 |
| 1980's | 709 | 682 | 790 | 727 | 761 | 832 | 764 | 657 | 675 | 691 |
| 1990's | 636 | 692 | 645 | 647 | 661 | 656 | 687 | 598 | 515 | 518 |
| 2000's | 530 | 501 | 518 | 517 | 487 | 473 | 450 | 481 | 521 | 524 |
| 2010's | 495 | 492 | 406 | 523 | 522 | 434 | 425 | 434 | 496 | 530 |
| 2020's | 460 | 435 | 488 | 456 | 420 |
| - = No Data Reported; -- = Not Applicable; NA = Not Available; W = Withheld to avoid disclosure of individual company data. |
| Release Date: 6/30/2026 |
| Next Release Date: 7/31/2026 |