|
Download Data (XLS File) |
|
|||||
|
|||||
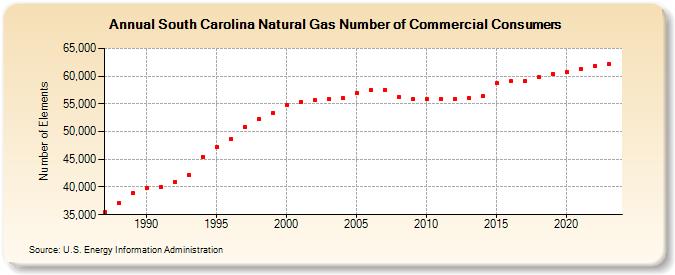
| South Carolina Natural Gas Number of Commercial Consumers (Number of Elements) | |||||
| Decade | Year-0 | Year-1 | Year-2 | Year-3 | Year-4 | Year-5 | Year-6 | Year-7 | Year-8 | Year-9 |
|---|---|---|---|---|---|---|---|---|---|---|
| 1980's | 35,414 | 37,075 | 38,856 | |||||||
| 1990's | 39,904 | 39,999 | 40,968 | 42,191 | 45,487 | 47,293 | 48,650 | 50,817 | 52,237 | 53,436 |
| 2000's | 54,794 | 55,257 | 55,608 | 55,909 | 56,049 | 56,974 | 57,452 | 57,544 | 56,317 | 55,850 |
| 2010's | 55,853 | 55,846 | 55,908 | 55,997 | 56,323 | 58,703 | 59,085 | 59,109 | 59,799 | 60,405 |
| 2020's | 60,744 | 61,285 | 61,868 | 62,216 | 63,268 |
| - = No Data Reported; -- = Not Applicable; NA = Not Available; W = Withheld to avoid disclosure of individual company data. |
| Release Date: 6/30/2026 |
| Next Release Date: 7/31/2026 |