|
Download Data (XLS File) |
|
|||||
|
|||||
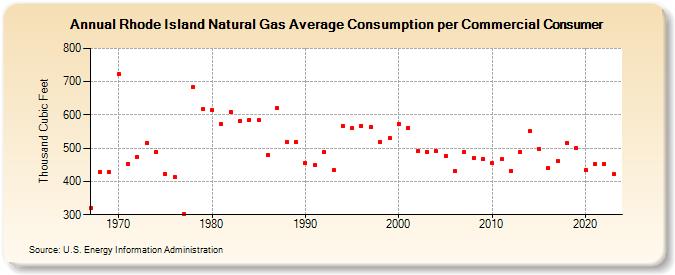
| Rhode Island Natural Gas Average Consumption per Commercial Consumer (Thousand Cubic Feet) | |||||
| Decade | Year-0 | Year-1 | Year-2 | Year-3 | Year-4 | Year-5 | Year-6 | Year-7 | Year-8 | Year-9 |
|---|---|---|---|---|---|---|---|---|---|---|
| 1960's | 320 | 427 | 428 | |||||||
| 1970's | 723 | 453 | 473 | 516 | 489 | 423 | 414 | 302 | 683 | 617 |
| 1980's | 614 | 572 | 609 | 581 | 585 | 584 | 480 | 621 | 519 | 518 |
| 1990's | 454 | 449 | 488 | 435 | 568 | 562 | 568 | 563 | 518 | 530 |
| 2000's | 574 | 561 | 491 | 490 | 491 | 478 | 430 | 489 | 471 | 467 |
| 2010's | 454 | 468 | 432 | 490 | 551 | 499 | 440 | 462 | 517 | 501 |
| 2020's | 434 | 452 | 452 | 421 | 466 |
| - = No Data Reported; -- = Not Applicable; NA = Not Available; W = Withheld to avoid disclosure of individual company data. |
| Release Date: 6/30/2026 |
| Next Release Date: 7/31/2026 |