|
Download Data (XLS File) |
|
|||||
|
|||||
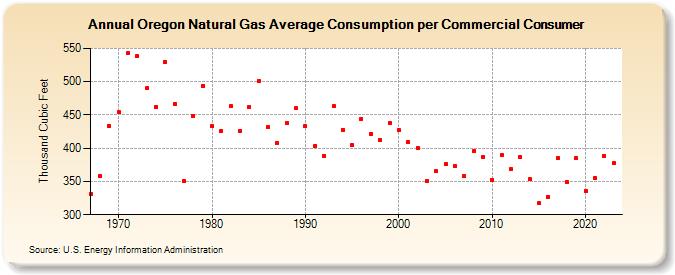
| Oregon Natural Gas Average Consumption per Commercial Consumer (Thousand Cubic Feet) | |||||
| Decade | Year-0 | Year-1 | Year-2 | Year-3 | Year-4 | Year-5 | Year-6 | Year-7 | Year-8 | Year-9 |
|---|---|---|---|---|---|---|---|---|---|---|
| 1960's | 331 | 358 | 433 | |||||||
| 1970's | 454 | 543 | 538 | 490 | 462 | 530 | 467 | 350 | 449 | 494 |
| 1980's | 433 | 426 | 463 | 426 | 462 | 501 | 432 | 408 | 438 | 460 |
| 1990's | 433 | 403 | 389 | 463 | 428 | 405 | 444 | 421 | 412 | 438 |
| 2000's | 427 | 409 | 401 | 350 | 365 | 376 | 373 | 358 | 396 | 387 |
| 2010's | 352 | 390 | 368 | 386 | 353 | 317 | 327 | 385 | 349 | 385 |
| 2020's | 336 | 355 | 388 | 377 | 357 |
| - = No Data Reported; -- = Not Applicable; NA = Not Available; W = Withheld to avoid disclosure of individual company data. |
| Release Date: 6/30/2026 |
| Next Release Date: 7/31/2026 |